Industrial Robot ROI: How to Calculate Payback (with a Free Calculator)
Most robot ROI models show 9-month payback because they use hardware cost only -- full-project payback is typically 18 to 36 months, and the free IRH ROI calculator gives you the honest number in minutes.
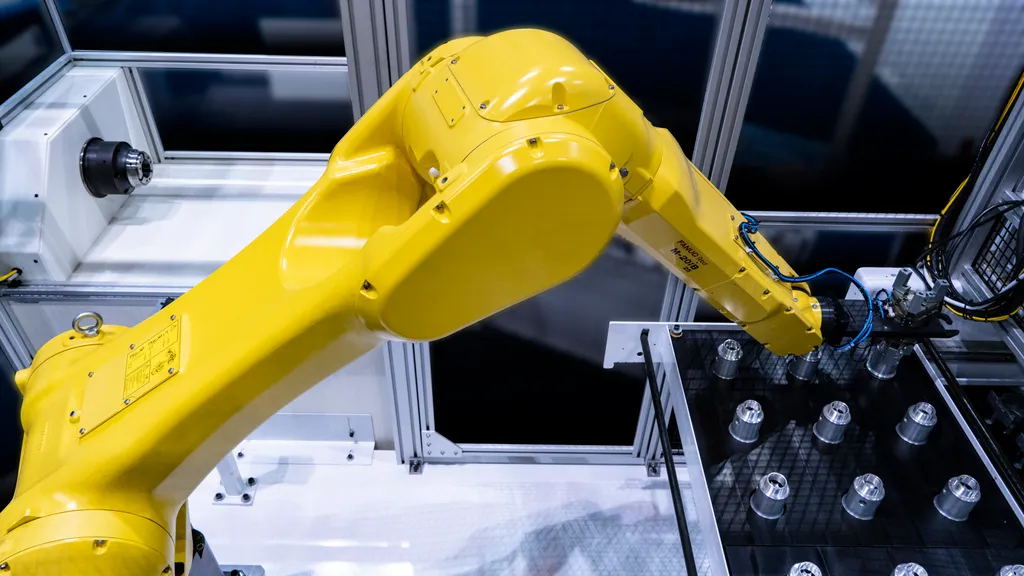
Typical payback for an industrial robot installation runs 18 to 36 months when you use the full installed cost. Get the number in minutes with the IRH ROI Calculator — or read on to understand the math before you run it.
That 18-to-36 month range assumes realistic inputs: full integration cost, not hardware-only. Buyers who model ROI on arm price alone routinely see projected payback of 9 to 12 months in their spreadsheets — and wonder why the actual project takes two years to return its investment. The formula is simple. The inputs are where the analysis goes wrong.
The core formula:
Payback (months) = Total installed cost / Monthly labor + overhead saved
Two numbers. Most models get one of them badly wrong. This guide explains how to get both right, and routes the actual number-crunching to the calculator where it belongs.
Why the arm price is the wrong starting point
The robot sticker price is not the project cost. It is the floor on one line item in a longer bill.
A mid-range 6-axis arm — payload 10 to 20 kg, reach around 1,400 mm — runs $40,000 to $80,000 from a tier-one vendor. As documented in our true cost of an industrial robot analysis, that arm sits inside a total installed cost that typically runs 2x to 5x the hardware price once you add integration, end-of-arm tooling (EOAT), safety fencing, commissioning, and first-year maintenance. The 2-5x range is consistent enough across cell types and industries that it functions as a planning rule.
For cobots on simple pick-and-place or machine-tending tasks, the multiplier can land as low as 1.8x to 2.2x. For complex articulated cells with full perimeter guarding, vision, and force sensing, it climbs to 4x to 5x — and sometimes beyond. Our integration cost reality post documents the extreme end: custom welding or painting systems can run 8-10x the arm price without any project failures, just physics and safety requirements.
The multiplier moves with complexity, not arm price. That is the planning reality your ROI model has to absorb.
What the 2-5x rule looks like as a cost breakdown
Where does the money go? For a representative mid-size cell — a 6-axis arm, 15 kg payload, machine tending or welding application, standard safety perimeter — the cost distribution from our true cost analysis looks like this:
| Cost category | Share of total installed cost | Typical range |
|---|---|---|
| Robot hardware | ~35% | $40,000 — $80,000 |
| Integration labor | ~28% | $22,500 — $80,000 |
| Safety fencing + guarding | ~15% | $15,000 — $40,000 |
| End-of-arm tooling | ~10% | $5,000 — $20,000 |
| Electrical, civil, controls | ~8% | $11,000 — $32,000 |
| Training + commissioning | ~4% | $7,000 — $23,000 |
| Total installed | 100% | $100,500 — $275,000 |
Source: The True Cost of an Industrial Robot, Industrial Robotics Hub.
The arm is 35% of the project budget in the midpoint scenario. Integration labor alone — at integrator day rates of $100 to $200 per hour for a typical 150 to 400 hour cell — is 28%. Safety fencing, whether that is a full perimeter for an articulated arm or a risk-assessment-triggered guarding setup for a cobot, is another 15%. None of those lines appear on the robot spec sheet. All of them appear on the capital appropriation request if you have sized it correctly.
Annual maintenance adds a further recurring cost: 3% to 15% of total system cost per year depending on operating hours and application severity. For the mid-range cell above, that is $3,000 to $41,000 per year. Budget for it from year one, not when the first service interval arrives.
The pricing opacity problem
Nearly every robot arm in our database publishes no price at all. Of 176 industrial robots across 12 brands in our database, 173 carry no price. Only Universal Robots ballparks a figure, and only on three of its e-Series cobots — the UR3e at roughly $25,000, the UR5e at roughly $35,000, the UR10e at roughly $45,000. Our full pricing analysis across 176 arms documents this: 98.3% of the market is “price on application.”
This matters for ROI modeling because the standard advice — apply a 4-6x multiplier to the arm price — requires you to know the arm price first. For the FANUC M-20iD/25 or any other tier-one arm without a published price, you cannot start the multiplication until you have an RFQ in hand. The calculator at /tools/roi-calculator/ is designed to work with cost ranges and project budgets rather than requiring a precise arm price to begin — which is the practical workaround for an industry that mostly will not tell you the number.
Worked example: a 25 kg-class machine-tending cell
This example uses a mid-payload arm scenario — 20 to 25 kg payload class, single-station machine tending, one-shift replacement target. All cost figures are ranges pulled from our published TCO analysis; none are specific to a single model. Label every assumption when you build your own version.
Assumptions (label these in your model)
| Input | Assumed value | Source / note |
|---|---|---|
| Robot hardware | $50,000 — $70,000 | Mid-payload, tier-one vendor, price on application |
| Integration labor | $30,000 — $60,000 | 200-400 hrs at $100-$200/hr, per IRH TCO data |
| Safety fencing + EOAT | $20,000 — $45,000 | Standard perimeter + custom gripper, per IRH TCO data |
| Electrical, civil, controls | $12,000 — $22,000 | IRH TCO midpoint estimate |
| Training + commissioning | $8,000 — $15,000 | IRH TCO range |
| Total installed cost | $120,000 — $212,000 | 2.4x — 3x hardware cost at midpoint |
| Annual maintenance | $6,000 — $18,000 | 5-8% of installed cost (IRH TCO range) |
| Labor rate displaced | $55,000 — $75,000/yr | One operator, fully-loaded cost |
| Shift coverage | 1 shift (8 hrs) | Single-shift assumption; see notes on uptime |
| Robot uptime | 85% | Conservative first-year target |
| Effective annual saving | ~$47,000 — $64,000 | Labor rate x uptime factor |
Payback structure
Using the midpoints: installed cost of roughly $166,000 and annual saving of roughly $55,000 yields a payback period of about 36 months.
At the optimistic end — simpler integration ($120,000 total installed), higher labor rate ($75,000 displaced), and 90% uptime — payback compresses to around 18 to 20 months.
At the conservative end — more complex integration ($212,000 total), lower labor rate ($55,000 displaced), 80% first-year uptime — payback extends to 40 to 48 months.
That is the real range a mid-payload single-shift cell produces when you use full installed cost. The 9-month number you sometimes see in vendor case studies is what happens when you run the formula with hardware cost only and exclude the 65% of the project budget that lives in integration, tooling, fencing, and maintenance.
Run your specific numbers — labor rate, shift count, local integrator rates, uptime target — in the ROI calculator at /tools/roi-calculator/. The calculator accepts total installed cost as a single input so you can enter your integrator quote directly, or use the itemized mode to build from the line items.
ROI inputs and where each number comes from
| Input | Typical source | Notes |
|---|---|---|
| Total installed cost | Integrator RFQ | The only reliable source; use TCO ranges before you have a quote |
| Annual labor cost displaced | Payroll / HR | Use fully-loaded cost (benefits, burden rate, overtime), not base wage |
| Number of shifts replaced | Operations data | Two-shift replacement roughly doubles the saving vs. one shift |
| Robot uptime | Integrator estimate or benchmark | First-year 80-90% is realistic; overclaiming this is the most common mistake |
| Annual maintenance cost | Vendor service contract or 3-15% of system cost | Budget from year one; do not assume zero |
| EOAT replacement | Integrator or vendor | At least one replacement set in year two for most applications |
| Overhead savings | Accounting (floor space, utilities, scrap rate) | Optional but real: include if your application demonstrably reduces scrap or rework |
| Tax / depreciation benefit | Finance team | Varies by jurisdiction; often improves year-1 effective cost significantly |
The labor cost displaced is the most commonly inflated input. Buyers sometimes use direct hourly wage without benefits, or model the robot replacing a person who is actually being redeployed rather than eliminated. Be specific about what happens to the displaced headcount; if the operator moves to another role, the saving is indirect and harder to quantify.
The uptime assumption is the second most common inflation point. A well-integrated cell running a mature cycle in year two may reach 90-95% mechanical availability. In year one, during runoff and initial process qualification, 80-85% is more honest. Modeling 95% uptime in month one is optimistic in a way that will embarrass the project sponsor at the 12-month review.
Common mistakes that break the ROI model
Budgeting only the arm. The most common error and the most consequential. A $60,000 robot saving $80,000 per year looks like a 9-month payback. A $180,000 installed project saving $80,000 per year is a 27-month payback. As documented in the true cost analysis, that difference is the same robot with integration properly included. Both numbers can be correct for the same arm. Only one is useful for a capital decision.
Ignoring integration scope. Integration cost as a share of total project commonly lands between 30% and 50% of total installed cost. Cell design and engineering alone can consume 400 to 600 hours for a complex multi-station cell at $100 to $250 per integrator hour. That number is not on the spec sheet and is not in the arm price. Our integration cost analysis documents the full line-item ranges.
Over-optimistic uptime. Mechanical availability and cell availability are different. A robot that is mechanically available 95% of the time still produces zero parts when the upstream conveyor jams, the fixture wears out, or the EOAT needs cleaning. Model cell availability, not arm availability, and start from 80-85% in year one.
Forgetting maintenance and EOAT. Annual maintenance runs 3-15% of total system cost. EOAT wears — budget for at least one replacement set in year two for most applications. Force-torque sensors and adaptive grippers add further recurring cost. A five-year ROI model that shows zero maintenance spend in years 3-5 is not a model.
Single-shift only math. If the application can support two or three shifts with the same cell, the denominator in the payback formula changes significantly. A cell that displaces one operator at $60,000 per year fully loaded returns its investment in one timeframe. The same cell running two shifts and displacing two operators returns it in roughly half the time. Run both scenarios and understand what is actually achievable before locking in the business case.
Not comparing to the robot catalog to understand whether the arm you are speccing is the right spec class for the application. Over-speccing payload or reach adds arm cost and potentially integration complexity without improving the ROI. Use the compare engine to see side-by-side specs before finalizing the arm selection.
Run your numbers
The formula is the easy part. Getting the inputs right is the work.
Before you build a capital request, make sure the model includes:
- Total installed cost (not hardware cost) from an integrator RFQ or from the TCO ranges above if you are pre-quote
- Fully-loaded labor cost including burden rate, not just base wage
- An uptime assumption your integrator will stand behind, not one that makes the payback look good
- Annual maintenance from year one
- A multi-shift scenario if the cell can support it
Every one of those inputs is a slider in the IRH ROI Calculator at /tools/roi-calculator/. Enter your integrator quote as a lump sum or build from line items, adjust shift count and labor rate for your facility, and set your maintenance assumption. The calculator outputs payback period, 5-year NPV, and year-by-year cash flow — the three numbers a capital committee actually wants to see.
If you are still at the shortlisting stage and do not have an integrator quote yet, the robot catalog at /robots/ and the compare engine at /compare/ are where to narrow the arm selection. The ROI model waits for the quote. The spec selection does not.
The math for an industrial robot ROI case is simple arithmetic. The discipline is using the right numbers. Start with full installed cost. Build the saving from real labor data. Model maintenance as a cost, not a footnote. Then run it in the calculator and see where the payback actually lands.
Cost ranges in this post are sourced from IRH’s true cost analysis and integration cost analysis, which draw on published industry sources. Specific arm prices are not available for 98.3% of the robots in our database; see how much does an industrial robot cost for the full pricing transparency analysis.
Compare these robots