FANUC Orders Jumped 37%. The Stock Fell 19% Anyway
FANUC's orders surged 37% and its robot division grew 18.7% last quarter. The stock still had its worst day since 1986. Here's what our database found.
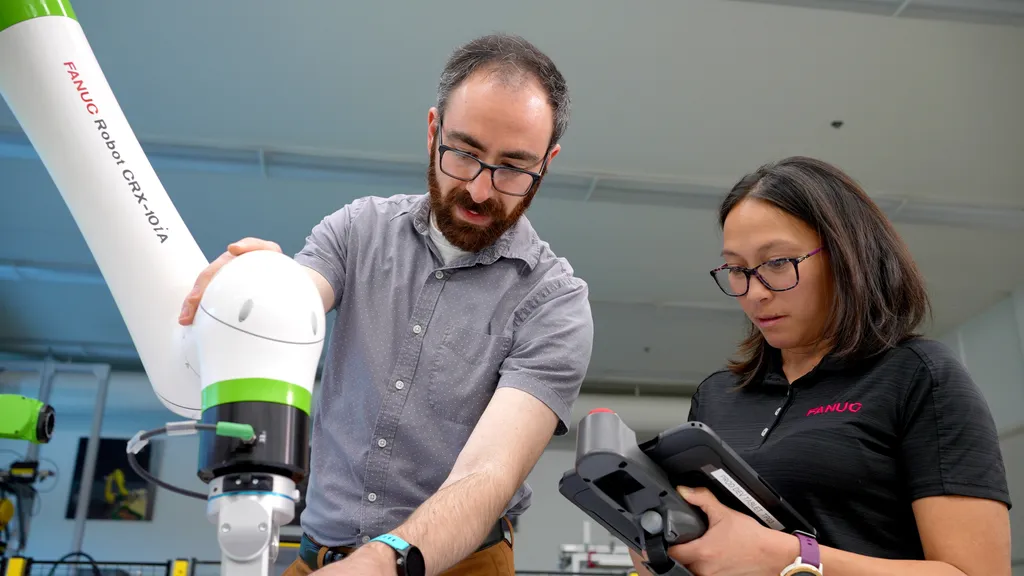
FANUC’s orders jumped 37% in the June quarter, its Robot Division grew 18.7%, and management raised full-year guidance. The stock still had its worst day in 40 years, down 19% intraday in Tokyo on August 3. The raise was real. It just wasn’t big enough for what analysts had priced in. Underneath the earnings paradox sits a quieter fact worth knowing if you buy robots for a living: of the ten largest brands in our database, FANUC now carries the lowest automotive-industry concentration and the second-highest cobot share, which happens to be exactly the shape of demand its own filing describes.
What did FANUC actually report?
FANUC posted consolidated net sales of ¥231,035 million for the three months ended June 30, 2026, up 17.7% year over year. Operating income rose 26.1% to ¥53,492 million, ordinary income climbed 32.3% to ¥68,193 million, and net income attributable to owners of the parent rose 34.7% to ¥50,981 million. EPS came in at ¥54.63, up from ¥40.56 a year earlier. Every line accelerated faster than sales, a sign of margin expansion, not just volume.
The company reports across four divisions, and the split tells you where the growth actually came from:
| Division | Q1 FY2026 net sales | YoY growth | Share of total |
|---|---|---|---|
| Robot | ¥96,103 million | +18.7% | 41.6% |
| FA (CNC systems) | ¥57,352 million | +15.5% | 24.8% |
| Robomachine | ¥41,654 million | +22.8% | 18.0% |
| Service | ¥35,926 million | +13.0% | 15.5% |
Source: FANUC Corporation, Consolidated Quarterly Financial Results for the three months ended June 30, 2026, filed July 31, 2026.
Robots are the largest of FANUC’s four divisions this quarter, at 41.6% of net sales, and grew faster than the FA and Service lines. Robomachine (injection molding machines and the like) actually posted the fastest growth rate at 22.8%, but off a smaller base.
Full-year FY2026 guidance moved up too. Net sales guidance rose to ¥948,100 million from the April forecast of ¥909,600 million, a 4.2% increase to the forecast and 10.5% growth over the FY ended March 2026’s actual ¥857,831 million, both figures stated directly in FANUC’s own guidance table. Operating income guidance rose to ¥218,000 million from ¥212,200 million, up 2.7% from the prior forecast and 18.6% year over year.
Why did the stock crater on a good quarter?
Because “raised guidance” and “raised guidance enough” are different sentences, and Wall Street was pricing the second one. According to the Japan Times, FANUC reported a 37% surge in company-wide orders for the June quarter and lifted its full-year operating profit forecast by about 3%, matching the 2.7% figure above. Analysts had modeled a 23% rise in operating profit for the year. FANUC guided to roughly 19%. That six-point gap between what the market wanted and what the company delivered sent shares down 19% intraday in Tokyo on Monday, August 3, “the biggest intraday decline since 1986,” per the same report. The stock is now down roughly 3% year to date, despite a quarter where every headline number grew double digits.
FANUC’s own explanation is a cost story, not a demand story: the company has been working to procure materials and components while absorbing rising costs for semiconductors, other electronic parts, and shipping. Orders are strong. Margins are being defended against input-cost pressure that a lot of manufacturers are currently fighting. Investors who wanted the guidance raise to erase that pressure entirely didn’t get it, and punished the stock accordingly. The Japan Times converts the ¥218 billion operating profit forecast to roughly $1.4 billion at prevailing rates, for anyone thinking in dollars.
Where is the growth actually coming from?
FANUC’s own regional commentary on the Robot Division explains the shape of the 18.7% growth, and it’s not evenly distributed. In Japan, sales to automobile-related industries stayed sluggish, while sales to general industries stayed strong and beat the prior year. In the Americas, sales rose on strength in both automotive and general industries. In China, sales rose on firm demand from EV-related and general industries.
Put plainly: the home market’s auto sector is soft, the Americas are broad-based, and China is being carried by EV manufacturing rather than legacy auto lines. That’s a diversification story wearing a beat-and-raise headline.
Is FANUC’s catalog actually built for that shift?
That regional commentary is a claim about this quarter’s order mix. We wanted to know whether FANUC’s product catalog is actually positioned for it, or whether the company is just riding a cyclical wave with a lineup still concentrated in traditional auto-line arms. So we ran the numbers against our own database of 400 robots across the ten largest brands we track.
FANUC has 31 robots in our database, the third-largest single-brand catalog behind ABB’s 40 and Yaskawa’s 38. Sorting the ten largest brands by the share of their catalog tagged for automotive industries puts FANUC dead last:
| Brand | Robots tracked | Automotive-tagged | Cobot share |
|---|---|---|---|
| Siasun | 19 | 19 (100.0%) | 21.1% |
| Rokae | 21 | 18 (85.7%) | 52.4% |
| Kawasaki | 24 | 20 (83.3%) | 20.8% |
| KUKA | 29 | 24 (82.8%) | 17.2% |
| ABB | 40 | 30 (75.0%) | 15.0% |
| Estun | 29 | 21 (72.4%) | 0.0% |
| Inovance | 21 | 14 (66.7%) | 0.0% |
| Yaskawa | 38 | 24 (63.2%) | 10.5% |
| Epson | 21 | 13 (61.9%) | 0.0% |
| FANUC | 31 | 19 (61.3%) | 32.3% |
Source: our analysis of the 400 robots in the Industrial Robotics Hub database, querying each robot’s industries tags and robotType field.
FANUC’s 61.3% automotive share is not just the lowest of the ten, it’s below the database-wide average of 72.0% (288 of 400 robots database-wide carry an automotive tag). It’s also the second-highest cobot share among these ten brands at 32.3%, behind only Rokae, whose 21-robot catalog is a much smaller, purpose-built cobot line. FANUC’s cobot share is more than double ABB’s (15.0%), nearly double KUKA’s (17.2%) and Kawasaki’s (20.8%), and roughly triple Yaskawa’s (10.5%).
Breaking down FANUC’s 31 tracked robots by type: 10 are cobots (the CRX series plus the older CR collaborative line), 11 are conventional articulated arms, 3 are delta robots, 3 are SCARA, 2 are palletizers, 1 is a welding robot, and 1 is a painting robot. That’s a genuinely wide spread, and it’s one of the broadest robotType breadths in our database, which we’ve covered separately.
None of this means the catalog caused this quarter’s 37% order surge or the 18.7% Robot Division growth. Catalogs don’t move that fast, and correlation here is not causation. What it does mean is that FANUC’s product lineup was already shaped like the demand its own commentary describes, low automotive concentration, high cobot representation, before this quarter’s numbers landed. That’s either a lucky coincidence or evidence the company saw the shift coming and built for it years ago. Either way, the alignment between what FANUC said happened and what FANUC actually sells is unusually clean.
What this means if you’re comparing brands
If you’re a buyer or integrator evaluating legacy robot brands for a project outside the traditional automotive line, this table is a reasonable proxy for “how much has this brand actually diversified its catalog,” separate from what any single earnings call claims. ABB, KUKA, and Kawasaki still carry automotive-tag shares above 75%, which is fine if you’re building an automotive line and want a vendor with deep bench strength there. If you’re chasing general-industry, EV-adjacent, or non-automotive growth, and most cobot demand growth in 2026 is coming from outside automotive already, FANUC’s catalog breadth across cobots, articulated arms, SCARA, and delta platforms gives it more shelf space to sell into that shift than most of its legacy peers. The FANUC brand page and the CRX-10iA spec sheet are good starting points if you want to see the specific hardware behind that 32.3% cobot share. The stock market didn’t reward FANUC’s quarter. The catalog data suggests the underlying positioning is sound regardless of what Wall Street wanted this week.
Compare these robots