Robot Orders 2026: Automotive Fell 35%, Cobots Grew 56%
North American robot orders held flat in Q1 2026, but automotive OEM orders fell 35% while collaborative robot orders grew 56%, per new A3 data.
North American robot orders were flat in Q1 2026. Automotive OEM orders fell 35 percent. Both of those sentences are true at the same time. The Association for Advancing Automation (A3) reported 9,055 robots ordered in North America in Q1 2026, worth $543 million, essentially unchanged from Q1 2025 (-0.1% in units, -6.4% in revenue). That headline reads like a boring quarter. It is not. Automotive OEM orders collapsed 35.1% in units and 48.2% in revenue, and nearly everything else grew, some of it sharply. Collaborative robots grew fastest of all: 55.6% in units, 78.2% in revenue.
How did North American robot orders actually perform in Q1 2026?
Total orders: 9,055 units, $543 million, down 0.1% in units and 6.4% in revenue versus Q1 2025, per A3’s own release, corroborated by Robotics 24/7 and Modern Materials Handling. A flat unit count with a bigger drop in revenue already tells you something: the mix shifted toward smaller, cheaper orders and away from the biggest-ticket buyer. That buyer is automotive, and A3 says as much directly, noting that given the size and timing of automotive programs, the OEM pullback had an outsized effect on the total number even though it is one segment among several.
Here is the same data as a ranked chart, one bar per segment, run against a zero line so the one segment that shrank is visually obvious instead of buried in a footnote.
One bar runs the other direction. That is not a chart bug, that is the story.
Why did automotive OEM orders fall 35% in one quarter?
Automotive OEM orders (the carmakers themselves, not their parts suppliers) fell 35.1% in units and 48.2% in revenue year over year. That is the steepest drop in the report, and because automotive has historically been the single largest buyer category in North American robotics, a drop that size drags the whole market’s revenue number down even when unit counts elsewhere are growing. A3 frames it plainly: the outsized impact comes from the size and timing of automotive capital programs, not from automation losing favor as a strategy. When an OEM delays or cancels a line retooling, the order swing is measured in hundreds of robots at once, not the incremental additions you see from a mid-size electronics contract manufacturer scaling up a cell.
What did not fall: automotive component suppliers, a separate segment from the OEMs themselves, grew 28.1% in units and 15.5% in revenue in the same quarter. That is not a typo next to a 35% decline in the same industry vertical. A3 attributes it to component suppliers’ typical lag behind OEM ordering cycles, meaning suppliers are often still executing on programs the OEMs greenlit a year or more ago, while the OEMs themselves are already reacting to this year’s demand signal. If you sell or buy for the automotive supply chain, that lag is worth knowing: a bad OEM quarter does not mean your Tier 1 or Tier 2 order book turns bad on the same clock.
Which industries picked up the slack?
Every other tracked segment grew in Q1 2026, and two of them grew by more than half:
- Life Sciences/Pharma/Biomed: +54.1% units, +70.2% revenue
- Semiconductors & Electronics/Photonics: +31.7% units, +79.2% revenue
- Automotive Components: +28.1% units, +15.5% revenue
- Plastics & Rubber: +25.2% units, +32.6% revenue
- All Other Industries: +24.5% units, +29.2% revenue
- Food & Consumer Goods: +16.0% units, +16.3% revenue
Look at the revenue columns next to the unit columns and a second pattern shows up: semiconductors grew units 31.7% but revenue 79.2%, and life sciences grew units 54.1% but revenue 70.2%. Both segments are paying up per robot faster than they’re adding robots, which usually means heavier automation, tighter-spec arms, or more integration work bundled into the order, not just more of the same cheap unit. A3’s Alex Shikany put the broader shift in plain terms: automation demand is diversifying beyond automotive, in the industries buying it, the applications it’s used for, and how it’s deployed. Q1 2026 is the quarter where that diversification shows up in the actual order book, not just the trend pieces.
How fast are collaborative robots actually growing, and where?
Cobots ordered 1,637 units worth $69.8 million in Q1 2026, up 55.6% in units and 78.2% in revenue year over year, the fastest growth rate of anything in the report, faster than any single industry segment above. Even at that growth rate, cobots were still 18.1% of all robot units ordered and 12.9% of total order revenue in the quarter. Fast-growing and still a minority share are not contradictory facts here, they are the same fact from two angles.
Cobot share is not even across the segments driving this quarter’s growth. Within Life Sciences/Pharma/Biomed, cobots made up 60.7% of that segment’s own orders. Within Semiconductors/Electronics/Photonics, 45.9%. Within All Other Industries, 29.0%. Every one of those is well above the market-wide 18.1% cobot share.
| Segment | Cobot share of that segment’s Q1 2026 orders |
|---|---|
| Life Sciences/Pharma/Biomed | 60.7% |
| Semiconductors/Electronics/Photonics | 45.9% |
| All Other Industries | 29.0% |
| Overall (all segments) | 18.1% |
That is the real texture behind the “cobots beat the market” headline: the segments growing fastest this quarter are also the segments buying collaborative robots at two to three times the market-wide rate. A pharma or electronics buyer reading this quarter’s numbers is, more often than not, a cobot buyer.
What does IRH’s own robot database show about where cobots concentrate?
Our own catalog of 400 robots gives a second, longer-horizon vantage point on the same question, though it measures what’s offered across the whole database, not what got ordered in one quarter, so treat it as color, not a contradiction of the A3 order-level number above. Across every major industry tag we checked, cobots run 35 to 39% of the tagged catalog: automotive (a tag carried by 288 of our 400 robots, 72% of the whole catalog) sits at 35.4% cobot share, life sciences/pharma/medical at 36.1%, and semiconductor/electronics at 39.0%. Overall, 126 of our 400 robots (31.5%) are cobots.
| Catalog group | Robots tagged | Cobots | Cobot share |
|---|---|---|---|
| Automotive | 288 | 102 | 35.4% |
| Semiconductor/Electronics | 231 | 90 | 39.0% |
| Life Sciences/Pharma/Medical | 72 | 26 | 36.1% |
That 35 to 39% band sits well above this quarter’s 18.1% order-level cobot share. That gap is not a contradiction, it is the difference between what manufacturers have built and what buyers, in one specific quarter, actually put on a purchase order. We covered the fuller version of that catalog-versus-order gap using A3’s full-year and Q4 2025 data in Cobot Orders Hit 28.6%. Catalogs Are Already at 42%., and this quarter’s numbers are consistent with that earlier finding, not a reversal of it.
What should a buyer take from this?
If you buy for an automotive program, the market moved out from under you this quarter, not because automation stopped working but because you’re competing for the same supplier and integrator attention against segments growing 25 to 55% while your own segment shrank 35%. Lead times and engineering bandwidth tend to follow growth, and growth right now is in pharma, electronics, and cobots generally. That is worth a call to your account rep before you assume your usual quote turnaround still holds.
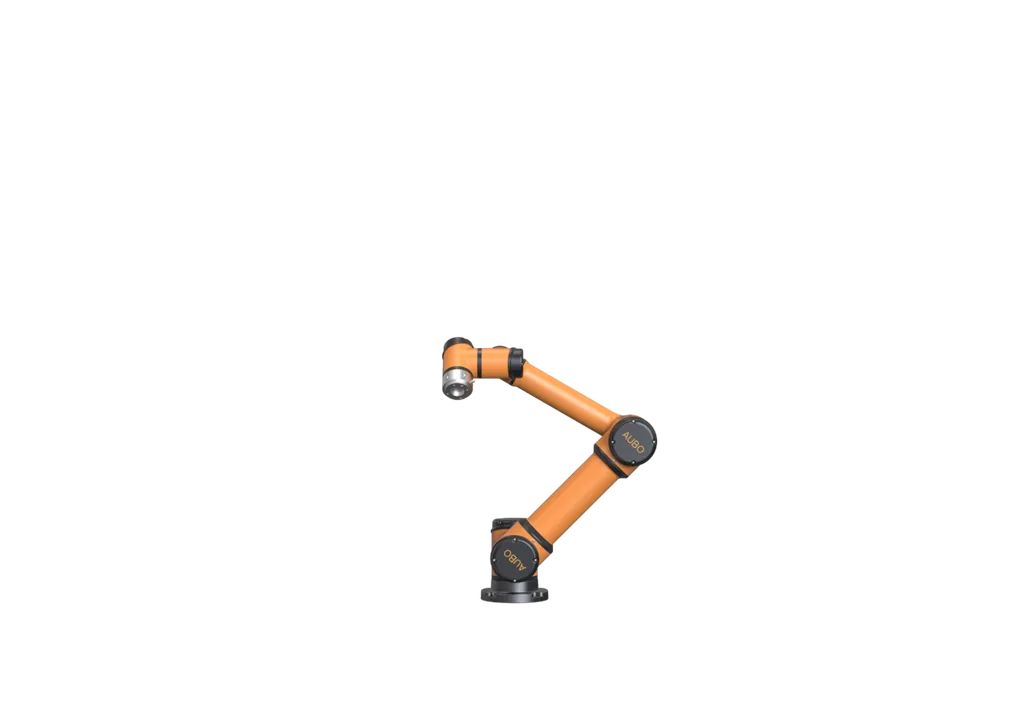
If you buy in life sciences or semiconductors, you are one of the fastest-growing customer groups your vendor has right now, and revenue-per-unit growing faster than unit growth in both segments suggests vendors are already prioritizing that demand with higher-spec, higher-margin product. That cuts both ways: more attention on your application, but also a real risk of longer lead times if a supplier’s capacity gets tight serving the segment that’s paying the most per order. A cobot like the AUBO iS7, IP67-rated and built for exactly this kind of pharma and electronics work, is a reasonable default shortlist entry precisely because it sits inside the segment where 45 to 61% of orders are already going collaborative. Check with your integrator on lead time before you assume last quarter’s timeline still applies. The flat headline number hid a real shift in who’s buying and what they’re buying. Buy accordingly, not off the aggregate.
For more on where cobots concentrate by application, see our cobot type overview. For the trade-policy backdrop shaping where these robots are sourced from, see New Robot Tariffs Target the Countries Behind 72% of Our DB. For the precision gap between the two biggest segments in this report, see Electronics Robots Need 2.5x the Precision of Automotive.
Compare these robots