Robot Power Efficiency: Watts Per Kilogram, Ranked
A 1,700 kg FANUC arm draws 5 W per kilogram of payload. A 0.5 kg Yaskawa micro-arm draws 1,000 W per kilogram, 200x worse. Power buys different things.
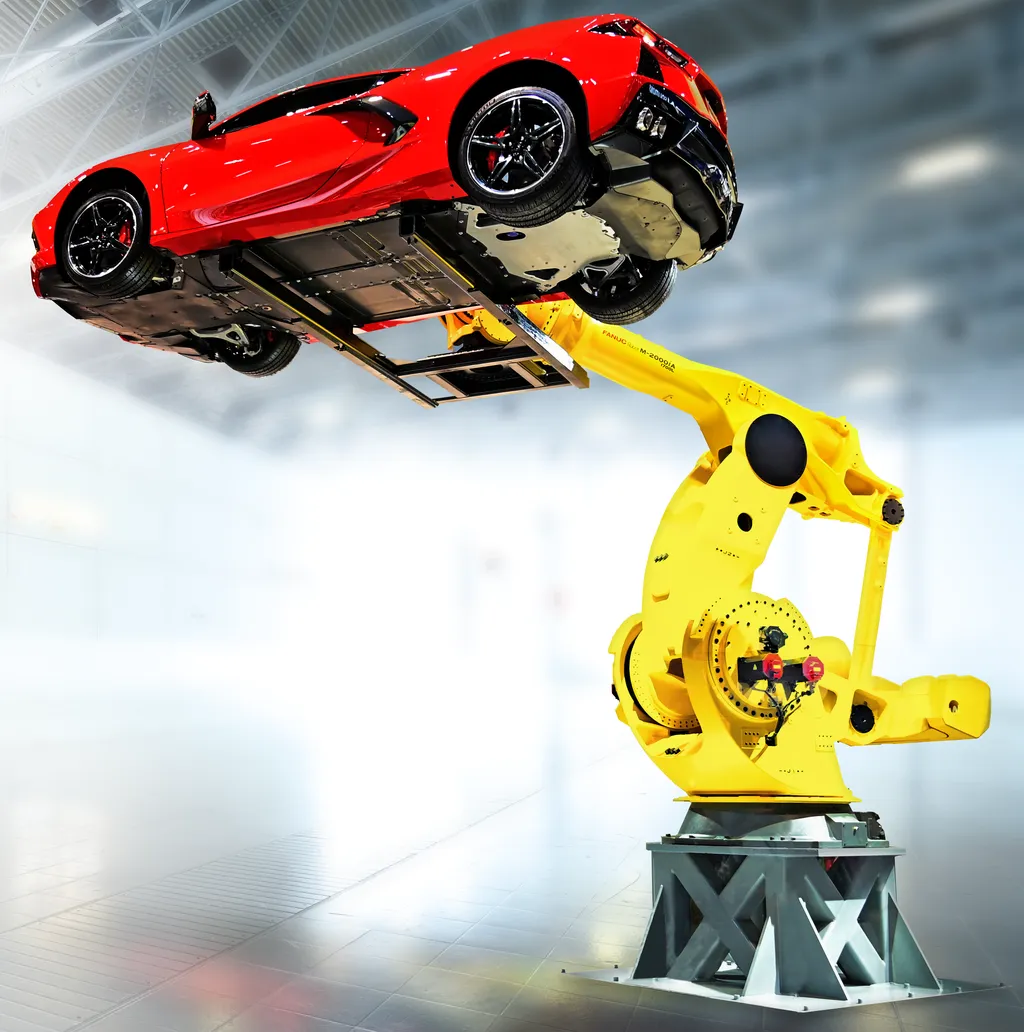
A FANUC M-2000iA/1700L, the heaviest robot in our database at 1,700 kg payload, draws 8,500W and works out to 5 watts per kilogram of payload capacity, the most efficient machine in our entire dataset by that measure. A Yaskawa MotoMINI, rated for 0.5 kg, draws 500W and works out to 1,000 watts per kilogram, 200 times worse. Same database, same power-consumption field, opposite ends of a metric almost nobody in industrial robotics talks about: energy per kilogram of actual payload capacity. Raw wattage tells you what a robot pulls off the wall. Watts per kilogram tells you what you’re getting for it, and the ranking looks nothing like “cobot versus heavy arm” intuition predicts.
What is power efficiency for a robot, and why does raw wattage hide it?
Watts per kilogram is just power.powerConsumptionW divided by performance.payloadKg for every robot that publishes both. In our database, 92 of 265 robots (34.7%) publish a power-consumption figure at all, and every one of those also carries a payload rating, so the full 92-robot set is usable for this comparison. For the raw-wattage breakdown by robot type, the coverage gap by brand, and what 1,000 hours of runtime costs at current electricity rates, we already covered that ground in How Much Power Does an Industrial Robot Use?. This post is about a different question: for the power a robot draws, how much payload capacity are you actually buying?
Which robots get the most work per watt?
Six robots lead the database on efficiency, and four of them are heavy FANUC arms:
| Robot | Type | Payload | Power | W/kg |
|---|---|---|---|---|
| FANUC M-2000iA/1700L | Articulated | 1,700 kg | 8,500 W | 5.00 W/kg |
| FANUC M-410iB/700 | Palletizer | 700 kg | 6,000 W | 8.57 W/kg |
| FANUC M-900iB/400L | Articulated | 400 kg | 4,500 W | 11.25 W/kg |
| FANUC R-2000iC/165F | Articulated | 165 kg | 2,500 W | 15.15 W/kg |
| Yaskawa GP280 | Articulated | 280 kg | 5,000 W | 17.86 W/kg |
| FANUC M-410iC/185 | Palletizer | 185 kg | 3,500 W | 18.92 W/kg |
Every one of the six carries a payload rating in the hundreds or thousands of kilograms. That’s the pattern: efficiency by this measure rewards moving genuinely heavy loads, because a fixed increase in motor and controller power buys a proportionally larger jump in lift capacity once you’re already in heavy-arm territory.
Which robots waste the most power per kilogram?
The bottom of the ranking is not a robot-class story, it’s a payload-size story, and it cuts across three different architectures:
| Robot | Type | Payload | Power | W/kg |
|---|---|---|---|---|
| Yaskawa MotoMINI | Articulated | 0.5 kg | 500 W | 1,000.00 W/kg |
| ABB YuMi IRB 14000 | Cobot (dual-arm) | 0.5 kg | 220 W | 440.00 W/kg |
| FANUC M-3iA/6S | Delta | 6 kg | 2,000 W | 333.33 W/kg |
| Epson T3 | SCARA | 3 kg | 660 W | 220.00 W/kg |
| Epson T6 | SCARA | 6 kg | 1,200 W | 200.00 W/kg |
| Epson VT6L | Articulated | 6 kg | 1,200 W | 200.00 W/kg |
An articulated micro-arm, a dual-arm cobot, a delta robot, and two SCARA-class machines all land in the same bad-efficiency territory, and the one thing they share is a payload rating under 6 kg, not a shared architecture. A controller has to run, a motor has to hold its own arm against gravity, and that overhead is nearly fixed regardless of how little weight the robot is rated to carry. Divide a near-fixed power draw by a tiny payload number and the ratio blows up. That’s not necessarily bad engineering, it’s the same overhead every small robot pays, expressed as a scary-looking number.
Does efficiency track robot class, or just payload size?
Median watts-per-kilogram by type shows the same effect at a category level, heavy-payload classes look efficient and light-payload classes look wasteful:
But the individual-robot tables above already broke that clean story: a delta robot and a SCARA robot and an articulated arm and a cobot all showed up in the same bottom six, because what actually predicts poor W/kg is a payload rating under 6 kg, not the robot’s category. Delta (n=2) looks worst in the type table partly because both of its data points happen to be small-payload machines, not because delta arms are inherently wasteful; a delta robot rated for heavier picking would likely land in a different band entirely. Small sample sizes for delta and welding mean those two rows should be read as directional, not definitive.
What should this change about how you read a spec sheet?
Don’t compare raw wattage across robots built for different payload classes, that comparison mostly measures size, and we’ve already covered that version of the story with real cost numbers in our companion post on power consumption. Don’t take a watts-per-kilogram number at face value either, because it collapses into a fixed-overhead artifact once payload drops below a few kilograms, punishing small robots for a controller draw they can’t avoid. The comparison that actually means something is within a class: two 20 kg cobots’ W/kg figures are worth putting side by side, a 0.5 kg micro-arm’s W/kg against a 1,700 kg giant’s is not. If efficiency genuinely matters for your application, ask a supplier for power draw at your target payload and duty cycle, not a spec-sheet wattage in isolation, because the number on the page can mean opposite things depending on what class of robot it’s attached to.
Compare these robots