Robot Safety Data: 70% of Injuries Come From Fixed Arms
A peer-reviewed OSHA analysis of 77 robot accidents found 70% happened on stationary arms, not mobile robots. Our own catalog is 98.3% stationary.
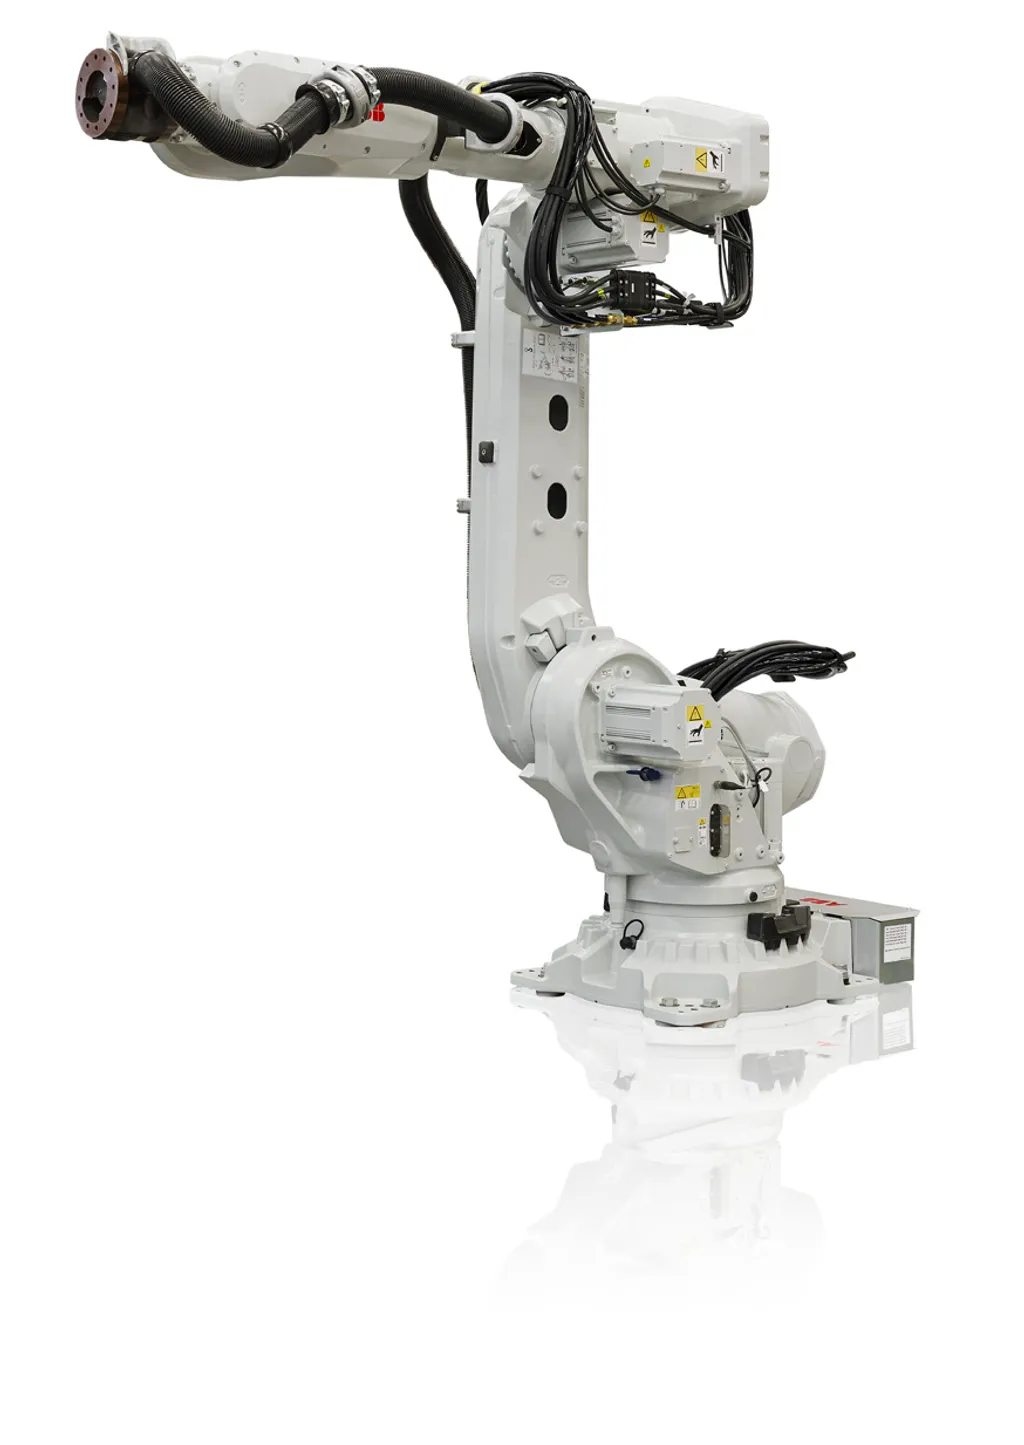
A peer-reviewed analysis of OSHA Severe Injury Reports found 77 robot-related accidents from 2015 to 2022. 54 of them, 70.1%, happened on stationary robots. Only 23, 29.9%, involved mobile robots. If you have been picturing an AMR clipping someone’s ankle in a warehouse aisle as the modern robot-safety headline, the actual injury data says otherwise: the fixed arm bolted to the floor is still where most of the damage happens.
That study is Sanders, Sener, and Chen’s 2024 paper in Applied Ergonomics: Human Factors in Technology and Society, available via its open-access institutional record and indexed on PubMed. It is the first real-world accident dataset IRH has cross-referenced against its own catalog. We ran the numbers against our 400-robot spec database, and the gap between what a “safety-rated” spec sheet documents and what the injury data says actually happens is worth a buyer’s attention.
How many robot accidents does the real safety data show?
The researchers pulled 77 robot-related accidents out of OSHA’s Severe Injury Report database, covering 2015 through 2022. That’s a small sample by epidemiology standards, but OSHA SIRs only capture severe injuries: amputations, hospitalizations, loss of an eye. This isn’t near-miss data or minor first-aid logs. Every entry in that 77 is a worker who lost a finger, broke a bone, or worse.
Those 77 accidents produced 93 total injuries (some accidents injured more than one person or caused multiple injuries per person).
Do stationary robots or mobile robots injure more workers?
Stationary robots, meaning fixed-base industrial arms, not wheeled or legged mobile platforms, accounted for both more accidents and more injuries:
| Robot Type | Accidents | % of Total | Injuries | % of Total | Primary Injury Sites |
|---|---|---|---|---|---|
| Stationary | 54 | 70.1% | 66 | 71.0% | Finger amputations, head/torso fractures |
| Mobile | 23 | 29.9% | 27 | 29.0% | Leg/foot fractures |
| Total | 77 | 100% | 93 | 100% |
Source: Sanders, N.E., Sener, E., and Chen, K.B. (2024), “Robot-related injuries in the workplace: An analysis of OSHA Severe Injury Reports,” Applied Ergonomics: Human Factors in Technology and Society, Vol. 121, Article 104324.
The accident-share and injury-share numbers track closely (70.1% vs. 71.0%, 29.9% vs. 29.0%), which tells you something useful on its own: stationary accidents aren’t producing wildly more injuries per incident than mobile ones. The exposure difference is closer to a straight count than a severity multiplier.
Note what this is not: it is not a per-robot injury rate. The study counts accidents in the total US industrial base over an eight-year window, not accidents per thousand robots deployed. Stationary arms have vastly outnumbered AMRs on factory floors for decades, so a larger accident count is partly just a larger population count. The study doesn’t normalize for fleet size, and neither will we pretend it does.
What kind of injuries do robots actually cause?
The injury-location breakdown is the part that should change how you think about guarding, because it splits cleanly by robot type:
- Stationary robots: predominantly finger amputations and fractures to the head and torso. This matches the classic pinch-point and reach-in-during-fault-clearing pattern integrators have warned about for years, an arm crushing or striking whatever is closest to its working envelope, which is usually hands and upper body.
- Mobile robots: predominantly fractures to legs and feet. A mobile platform’s hazard geometry is different. It travels at floor level, so a collision or a run-over event hits lower-body extremities, not hands or torso.
The researchers’ own conclusion, stated plainly in the paper, is that this pattern points to a specific engineering gap: the industry needs guards and collision-avoidance systems that detect individual extremities, meaning sensing that can distinguish a finger, a hand, a leg, or a foot, rather than systems that only register bulk-body presence in a zone. A safety curtain that stops a person from walking into a cell is not the same thing as a system that stops an arm before it closes on a hand that’s already inside the envelope.
How does IRH’s own catalog compare to the accident data?
We ran the same stationary-vs-mobile split against our own 400-robot spec database. The composition looks like this:
| Catalog Metric | Count | Share |
|---|---|---|
| Total robots tracked | 400 | 100% |
| Stationary-architecture robots | 393 | 98.3% |
| AMRs (mobile) | 7 | 1.8% |
All seven of our tracked AMRs are Omron models (HD-1500, LD-250, LD-60, LD-90, MD-650, MD-900, OL-450S), which is its own data-coverage gap worth naming rather than glossing over, but the stationary/mobile split itself is directionally consistent with the accident study: stationary architecture is both the larger real-world accident category (70.1%) and the overwhelmingly larger share of what a typical buyer is shopping (98.3%).
We want to be precise about what that comparison can and can’t tell you. The OSHA study’s population is every real-world robot-related accident reported across US industry from 2015 to 2022, not the 400 robots currently in our catalog. We are not claiming any robot in our database caused any of those 77 accidents, and a 400-robot spec snapshot from 2026 is not a 1:1 stand-in for eight years of deployed industrial robots nationwide. What the comparison does tell you is that the category doing most of the real-world injuring, stationary arms, is also the category dominating what buyers are actually evaluating today. That’s context on where safety-documentation scrutiny should be pointed, not a causal claim about specific machines.
Are “safety-rated” robots documenting the right kind of protection?
Here’s the number that should change how you read a spec sheet. Of our 393 stationary-robot entries:
| Safety Documentation | Count (of 393 stationary) | Share |
|---|---|---|
| Cites some safety standard (e.g. ISO 10218, PLd/SIL) | 320 | 81.4% |
| Carries a general collaborative rating | 131 | 33.3% |
Documents extremity-specific collision features (collaborativeFeatures) | 61 | 15.5% |
81.4% of stationary robots in our database cite some safety standard. That’s a healthy documentation rate on paper. But the study’s own recommendation is for collision-avoidance that specifically detects individual extremities, the exact injury pattern the data documents: fingers and hands for stationary arms, legs and feet for mobile platforms. Only 61 of 393 stationary robots, 15.5%, document that specific kind of feature.
General standards compliance and extremity-specific collision detection are two different things. A PLd Cat.3 rating tells you the safety-related control system meets a defined performance level. It does not by itself tell you whether the machine can distinguish a finger from empty air fast enough to stop before contact. See our companion pieces on ISO 10218-1:2025 citation coverage, PFL vs. SSM cobot mechanisms, and cell clearance under ISO 13857 for how those standards break down mechanically. None of them look at real accident data the way this study does, which is exactly why the gap between 81.4% and 15.5% is worth sitting with.
What this means for buyers and integrators
A spec sheet that cites ISO 10218 or lists a PLd/SIL rating is telling you the robot’s control system meets a design standard. It is not telling you whether the specific hazard pattern real injury data documents, finger and hand contact for a fixed arm working next to a person, extremity strikes for a mobile platform sharing floor space with foot traffic, is actually addressed. Those are separate claims, and only one of them shows up in most spec sheets.
If you’re evaluating a cell, not just an arm, ask the integrator or vendor directly whether extremity-aware collision detection is documented for that specific model, and get it in writing rather than assuming it from a general safety-standard citation. In our own catalog, that’s the difference between 320 robots that look safety-compliant and 61 that specifically document the protection this data says actually matters.
Compare these robots